

Course Description
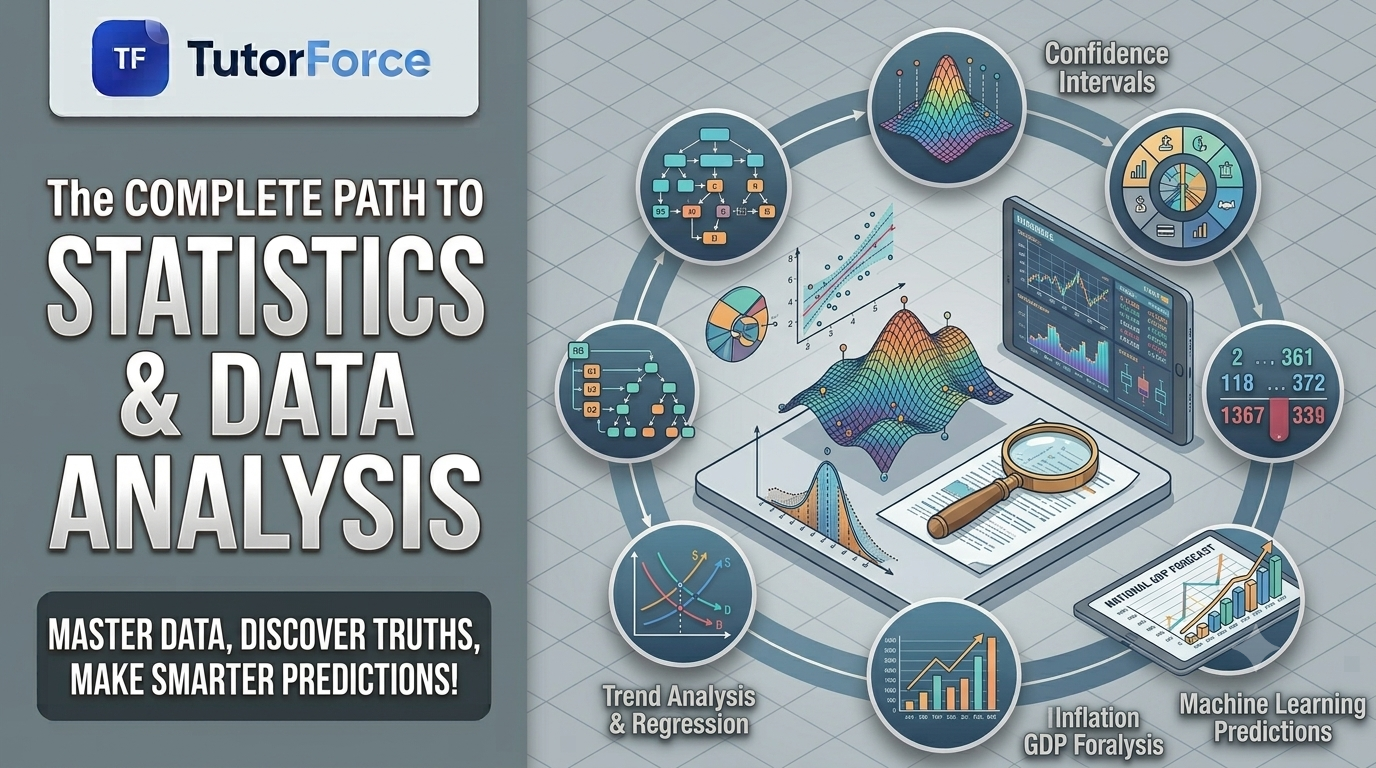
This course introduces the foundational tools and concepts required to collect, analyze, interpret, and draw meaningful conclusions from data. You will move from summarizing raw datasets with descriptive metrics to understanding probability theory and applying inferential methods—such as hypothesis testing, confidence intervals, and regression modeling. This curriculum arms you with the quantitative tools necessary to make data-driven decisions and evaluate statistical claims across scientific, business, and social research domains.
Core Topics
-
Data Collection and Descriptive Statistics: Variables, sampling techniques, visual summaries (histograms, box plots), measures of central tendency (mean, median, mode), and measures of variability (variance, standard deviation, IQR).
-
Probability Theory and Random Variables: Basic probability rules, conditional probability, Bayes’ Theorem, continuous vs. discrete distributions (Binomial, Poisson, Normal, and standard normal Z-scores).
-
Sampling Distributions and the Central Limit Theorem: Understanding how sample statistics approximate population parameters and why the Central Limit Theorem powers statistical inference.
-
Statistical Inference — Confidence Intervals and Hypothesis Testing: Constructing confidence intervals, setting up null and alternative hypotheses, calculating p-values, and conducting t-tests, z-tests, and Chi-Square tests.
-
Correlation and Regression Analysis: Quantifying relationships between variables through Pearson’s correlation coefficient, simple linear regression, slope interpretation, and evaluating goodness-of-fit ($R^2$).
FAQ
-
How does Statistics differ from Mathematics? While statistics uses mathematical formulas, it is fundamentally focused on interpreting real-world data subject to uncertainty, context, and variability, rather than proving abstract theoretical theorems.
-
Do I need specialized software like R or Python to complete this course? Basic statistical calculations can be done by hand or with a standard graphing calculator, but tools like Excel, R, or Python’s
scipy/pandaslibraries are commonly used to automate calculations and visualize complex datasets. -
What is the difference between statistical significance and practical significance? Statistical significance (p-value) tells you whether an observed effect is likely real or just due to random sampling chance. Practical significance evaluates whether the magnitude of that effect is actually large or meaningful enough to matter in real life.
Student Ratings & Reviews